Create charts with Vue ChartJs
Vue-ChartJs
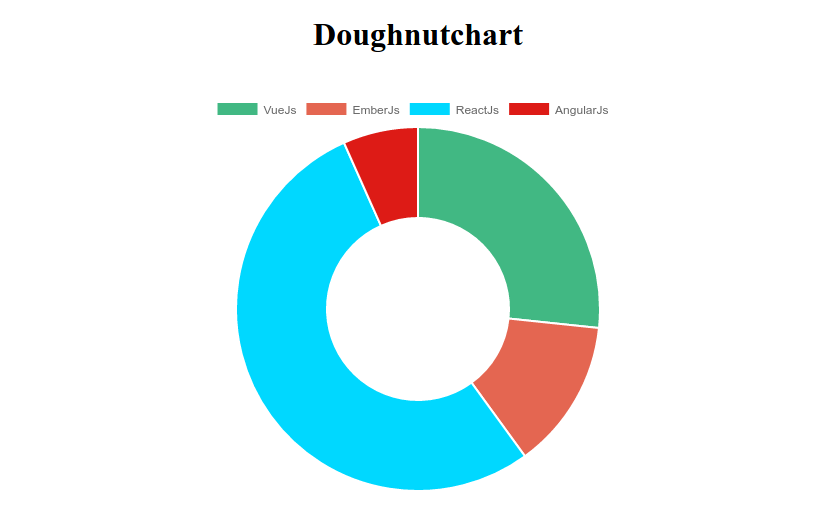
Vue-ChartJs is a Vue.js wrapper for Chart.js. Create easy your own chart components. Compatible with Vue.js 2.x and the version 1 with Vue.js 1.x.
Example
Install
npm install vue-chartjsCreate a new Js file and give it a name
newChart.js
import { Bar } from 'vue-chartjs'
// import the component - chart you need

export default Bar.extend({
  mounted () {
    // Overwriting base render method with actual data.
    this.renderChart({
      labels: ['January', 'February', 'March', 'April', 'May', 'June', 'July', 'August', 'September', 'October', 'November', 'December'],
      datasets: [
        {
          label: 'News reports',
          backgroundColor: '#3c8dbc',
          data: [12, 20, 12, 18, 10, 6, 9, 32, 29, 19, 12, 11]
        }
      ]
    },)
  }
})
Then import it in your main component like a normal vue component
App.vue
import CommitChart from './newChart'
import LineChart from './lineChart'
export default {
  components: {
    CommitChart,
    LineChart
  }
}
<template>
<div class="container">
<h1>Vue-ChartJs</h1>
<commitChart></commitChart>
<lineChart></lineChart>
</div>
</template>The result of the above, without the lineChart.js file


Vue ChatJs on GitHub.