DejaVue: Visualization and debugging tool built for Vue.js
DejaVue
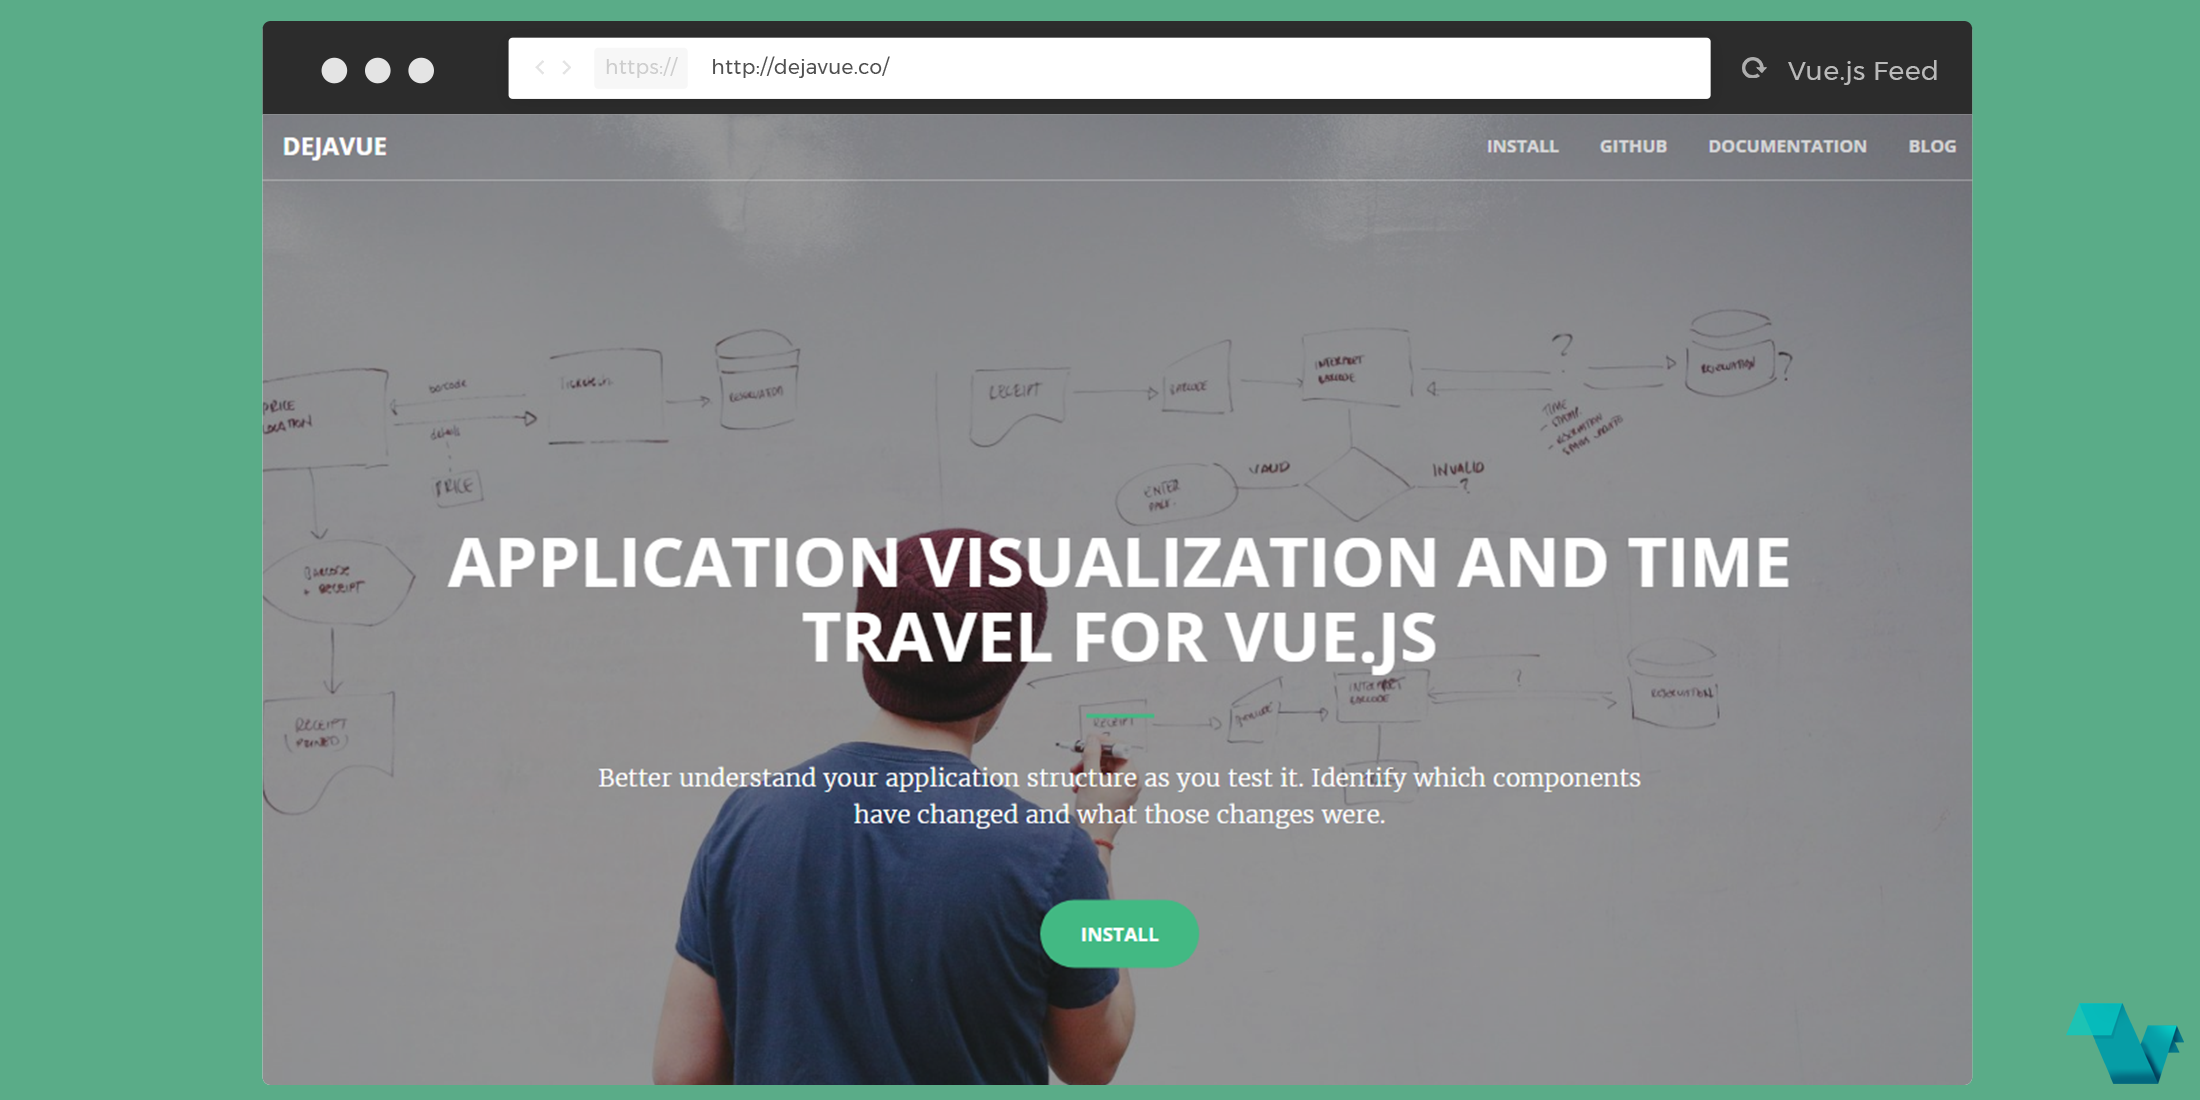
DejaVue is a chrome dev extension that helps you see how your application is running. It is essentially a visualization and stress testing debugging tool built for Vue.js. The team that built it had the idea some time ago, explained in the post Why we’re building DejaVue.js.
To give a visual interpertation of what DejaVue does here is an image to look at:
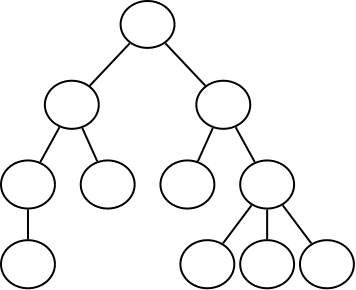
Each node represents a component, and the single node at the top represents the base. Every iteration of its children makes up the rest of the graph. It will also show you which props and variables are being rendered, and how it affects other components.
Application structure visualization. Component inspection. Time travel. Identify changed components and what changed due to another component's update. Better understand your application structure as you test it. Identify which components have changed and what those changes were.
The team has created also a video showing the extension in action (time travel feature): ) {.embedly-card}
If this seems interesting click here to download the extension from the Chrome store.
Features - all work with and without a state management library (e.g. Vuex)
-
Application Structure Visualization - Interactive tree
-
Component Inspection - view props, variables, and slots
-
Diff Engine - As you test see which components are being updated and what those changes are
-
Time Travel - Move backward and forwards through your state changes and see both the tree and your application update
- Component Highlighting - Hover over a tree leaf to highlight the component on your app